

Are Buses the Silver Bullet to Reduce Declines in Transit Ridership?
Reversing plummeting transit ridership is key to counteracting rising VMT
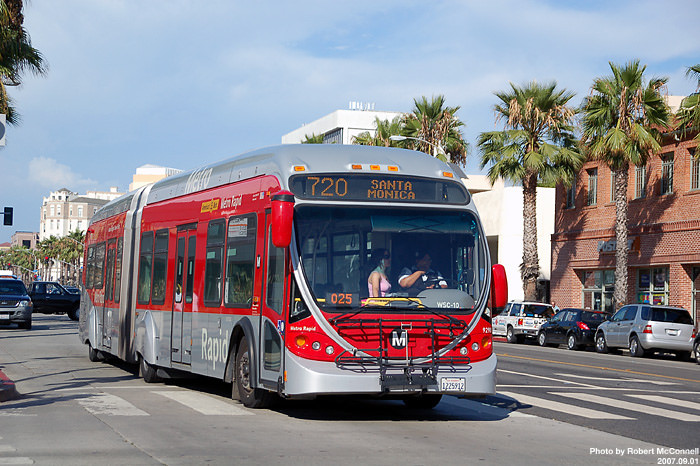
In my first deep dive into strategies to reduce vehicle miles travelled (VMT), I’m looking at declining transit ridership using Los Angeles as a case study since its ridership numbers drive the overall statewide trends. Investing in public transit is one of the most time-tested strategies for reducing personal VMT, since every car-owner we can convince to get on a bus or a train is one less car out on the road. The climate benefit to this ride-switch is especially apparent in states like California that are heavily investing in zero-emission buses. Figuring out how to reverse the national decline in transit ridership will be a key part of any VMT reduction strategy going forward.
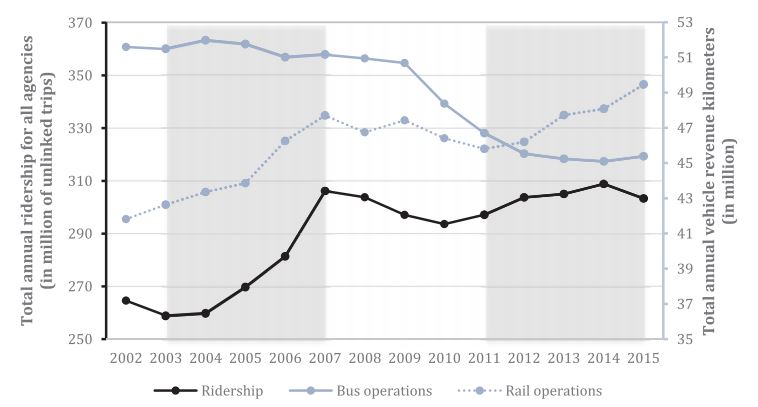
Transit ridership across the country has plateaued or even decreased over the last decade, led largely by substantial declines in bus trips. Over the same time period, transit agencies have been forced to raise fares and cut services thanks to post-recession declines in state, local, and federal funding. Unsurprisingly, studies have linked these cuts in service and fare increases to the decline in ridership. Notably, one major study from McGill University’s School of Urban Planning in 2018 surveying all North American transit agencies found “internal factors, rather than ridesourcing and gas price” were the “key determinants of ridership.” That is, quality and quantity of service are much more important factors in controlling ridership than outside factors like cheap gas prices and the emergence of transportation network companies (TNCs) like Uber.
In Southern California, on the other hand, a 2018 report from UCLA’s Institute of Transportation Studies (ITS) commissioned by the Southern California Association of Governments (SCAG) points to increased car ownership as a big part of the region’s significant transit ridership decline. UCLA scholars also found that gas prices and the rise of TNCs had not significantly impacted ridership. But the UCLA study also found that service changes did not significantly correlate with ridership declines in Southern California, in contrast with the McGill study’s broader North American findings.
Because Southern California’s transit usage is extremely concentrated in a relatively small percentage of the population, the UCLA study notes, even minor changes in the behavior of that population can have outsize impacts on ridership numbers as a whole. In the SCAG region (Los Angeles, Orange, Riverside, San Bernardino, Ventura and Imperial counties), the UCLA study found that only 2% of the population rides frequently (45 trips/month), 20% ride occasionally (12 trips/month), and more than 3/4 of the population ride little or no transit (<1 trip per month). Remarkably, ridership losses from LA Metro alone account for more than 72% of the entire state’s losses. And because ridership in LA Metro is so concentrated, “half of California’s total lost ridership is accounted for by 17 LA Metro routes (14 bus and 3 rail lines) and one OCTA route.”
The UCLA study attributes this decline in ridership to dramatic growth in first-time vehicle ownership among formerly carless frequent transit riders:
The growth in vehicle access has been especially dramatic among subsets of the population that are among the heaviest users of transit. Between 2000 and 2015, the share of households in the region with no vehicles fell by 30 percent, and the share of households with fewer vehicles than adults fell 14 percent. Among foreign-born residents, zero-vehicle households were down 42 percent, and those with fewer vehicles than adults were down 22 percent. Finally, among foreign-born households from Mexico, the share of households without vehicles declined an astonishing 66 percent, while households with more adults than vehicles dropped 27 percent. Living in a household without a vehicle is perhaps the strongest single predictor of transit use; the decline of these households has powerful implications for transit in Southern California.
At least some of this growth in regional car-ownership may be attributable to 2015’s AB 60, which gave undocumented immigrants the ability to obtain California driver’s licenses. As of March 2018, more than 1 million California residents had taken advantage of this program. To be clear, increased mobility for these families is an unequivocal economic and social good, and it would be grossly inequitable for transit advocates to seek to reverse vehicle ownership growth in this sector. This is especially true given both 1) the likelihood that these new car-owners have been priced out of urban centers and into far-flung neighborhoods not well-served by transit, and 2) the gigantic untapped market of more affluent infrequent transit users making up 77% of Southern California’s population.
As the UCLA study notes, low-income car-owners drive less frequently than affluent drivers, and are more likely to use their vehicles for “high-value” trips like traveling to and from work. Affluent drivers, on the other hand, drive much more frequently and are more likely to use their vehicles for “low-value” trips like running errands less than a mile away. In seeking to equitably reduce VMT then, it makes more sense from an economic and social perspective to focus on displacing the low-value car trips taken by affluent drivers with transit, rather than the high-value car trips taken by lower income drivers. Thus, the UCLA study concludes, “[t]he future of public transit in the SCAG region, then, will be shaped less by the mobility needs of people who do not own vehicles, and more by policy decisions that encourage vehicle-owning households to drive less and use transit more.”
But (and this is a big one), transit agencies should not increase affluent ridership if it comes at the expense of forgoing their responsibility as a social service. As a recent CityLab piece asked:
“What is the point of public transportation? Is it a social service to help those most in need? Or is it an environmental initiative to get drivers out of their cars? And can it ever be both?”
I do think it is possible to be both, but it requires careful consideration and community engagement in planning for the future.
Los Angeles, for example, has a checkered history in equitable and transparent metropolitan transportation planning. Back in the 1990s, the Los Angeles Bus Rider’s Union (represented by the NAACP Legal Defense Fund) famously sued LA Metro for civil rights violations, alleging discriminatory intent in disproportionate funding for rail versus buses (at the time, bus riders were 80% people of color and made up 94% of total Metro ridership, but received only 29% of Metro’s budget). Eventually, a consent decree would force LA Metro to limit fare increases to the consumer price index and reduce overcrowding with new bus purchases tied to decreasing the average load factor.
The race and class divide between bus and rail service–and between transit ridership and personal vehicle usage, more generally–highlighted by the Bus Rider’s Union is not unique to Los Angeles, nor is it an issue that we’re anywhere close to resolving. There is also, of course, a larger conversation to be had about just how fair the BRU’s criticisms were in the long-term, given the much higher up-front capital investment for rail that some argue eventually evens out with operational per-capita costs lower than buses.
But one way for cities to boost transit ridership (and hopefully reduce VMT) without disproportionately impacting core riders is to focus on their long-neglected bus systems. As you’ll note from the first table above, declines in bus ridership are driving the overall decline in transit ridership nationally. The McGill study looking broadly at all North American transit agencies concluded these declines were driven by service reductions and fare increases as a result of budget cuts. (Interestingly, while the UCLA study did not find a significant correlation between service quality and ridership, this was partially because they suspected LA Metro had adjusted its bus schedules to show higher “on-time” rates despite slower service–indicating that increasing service quality could help even with Southern California’s particular transit declines.)
One city has managed to buck the trend of declining bus ridership. While every other major city has seen double digit declines, Seattle has managed to increase its bus ridership by more than 30% since 2004:
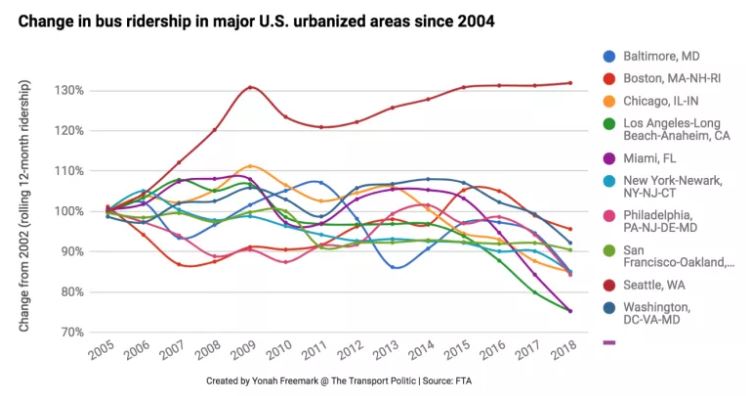
How? For one thing, Seattle ramped up off-peak bus service, adding additional late-night and weekend buses. This is a way to get at those affluent infrequent transit-riders, who may be more willing to hop on a bus for quick weekend errands if they know they won’t get stuck at bus stops for interminable wait times. Studies have shown that headway (the time a person has to wait at a stop between transit arrivals) is a major factor in making transit more attractive. And, as the UCLA study pointed out, SCAG for example only needs one out of four people in the infrequent transit riders group to replace a single driving trip with a transit trip once every two weeks to more than compensate for recent ridership declines. Of course, this kind of strategy only works if a city is able to do this in addition to maintaining and improving peak weekday service to avoid continuing to hemorrhage its core ridership group.
LA Metro is working on rethinking its own bus system for the first time in 25 years through the NextGen Bus Study, which uses an interactive tool to solicit public input on how to overhaul the county’s bus system:
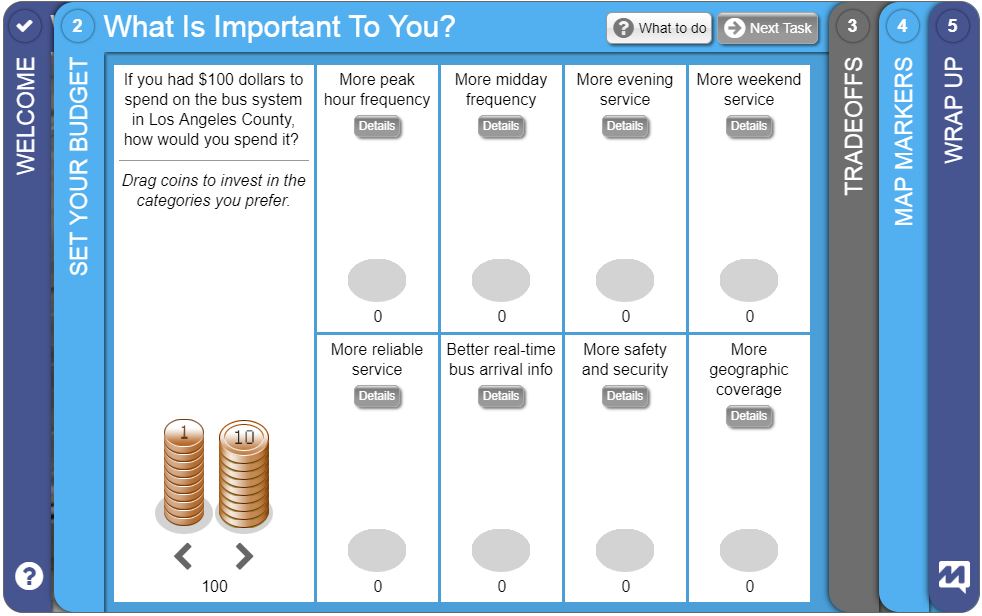
LA Metro is expected to announce results from this study early next year, with changes to be implemented as early as Fall 2019.
Seattle also has the lowest cost monthly pass in terms of single-ride equivalencies. It only takes 36 one-way trips (e.g., taking transit to and from work most weekdays), to make a monthly pass worth it in Seattle. LA Metro, by comparison takes 57 trips to be cost-effective, the most expensive in the country. By making monthly passes more attractive, Seattle has been able to incentivize more weekday commuters to use transit on the weekend since it’s “free” with their monthly pass.
While these two relatively simple strategies are cheaper than, for example, building out a new rail project–they aren’t free. So how can cities make these kinds of changes financially feasible? One approach gaining vocal support recently is to consider implementing congestion pricing. Cities can use fees collected from drivers to both subsidize public transit passes and fund transit improvements. To date, London is the most successful example of congestion pricing, and has reduced car traffic more than 40 percent since implementing a per-car charge to enter the city center in 2003 (currently ~$17.50 per car). New York was the first US city to contemplate congestion pricing, and in last week’s LA Metro board meeting, CEO Phil Washington endorsed implementing congestion pricing in Los Angeles with an eye towards making public transit in the county free by the time the Olympics roll around in 2028. Of course, any such congestion pricing scheme must be paired with effective public transit to avoid disproportionate impacts on those who are least likely to be able to afford such a fee–making focusing on reliable bus systems even more important.
Reader Comments
One Reply to “Are Buses the Silver Bullet to Reduce Declines in Transit Ridership?”
Comments are closed.


About Meredith
Meredith Hankins is the Shapiro Fellow in Environmental Law and Policy at UCLA School of Law for 2017-2019.…
READ more
Lot of nice ideas here, however…
… you need a certain population density to support buses. Like “water finding it’s level” the shift of population in the US is from more dense to less dense urban areas. Urban areas like Charlotte, NC, Austin, Raleigh are growing much faster both in %-age terms and in absolute numbers than large dense areas like NYC and LA. Part of this is because of the cost of housing increases with density and has become too costly in dense urban areas and partly because of increased congestion in the larger urban areas.
Reduce GHGe to zero in the top 10 metro areas, and it won’t make up for the increase in the next 40 urban centers. They don’t have the density to support buses.
Nice try, though.
Population shift from census data here:
https://meetingthetwain.blogspot.com/2018/10/on-move-1.html
The other issue that comes to mind is that very many cos. and govt.s around the world are pouring gobs of money into autonomous vehicles. Once Autonomous Electric Vehicles (AEVs) become common place, (2025?) the cost of transport on commercial shuttle services will be about $0.10/mile. At that point, big bulky, sloooww buses on fixed routes with fixed schedules will go the way of the oxcart. Stores will validate your shuttle voucher if you spend more than $10 in their store or restaurant. Employers will pay for your ride rather than have to pay for parking.
C.f., Tony Seba’s lectures on disruptive technologies, e.g.,
https://www.youtube.com/watch?v=2b3ttqYDwF0